Graphing Practice
|
How to Read a Bar Graph

“Some pictures are worth a thousand words” goes the old saying. Did you know that bar graphs are “pictures” of certain kinds of information? Lots of utility companies depend on them to give you a snapshot of your electric or gas usage.
In this lesson you will:
Skills: Charts, Graphs, Tables |
Understanding Mean, Median and Mode
What’s the average time you spend talking on the phone? How many miles per gallon does your car get, on average? When you’re working with averages, you’re crunching a lot of numbers into one handy number that gives a general idea of what you’re measuring. Stick with this lesson and you’ll learn a few useful ways to crunch the numbers in your life.
In this lesson you will:
Skills: Mean, Median, and ModeBasic MathCharts, Graphs, Tables |
Bacteria Growth
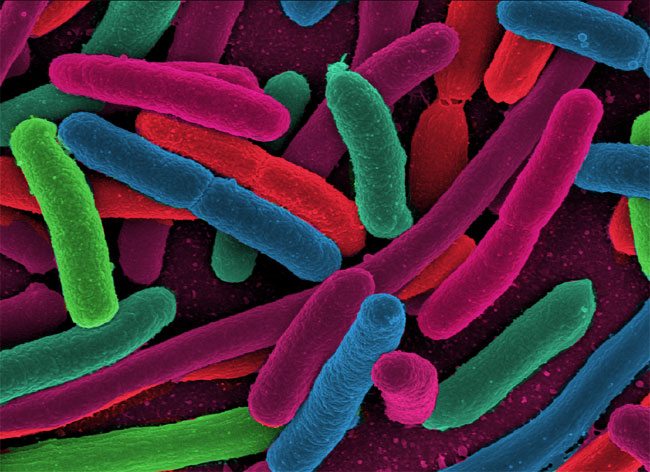
Bacteria are tiny microbes that tend to grow very quickly and form huge colonies. One teaspoon of soil can be home to as many as 1,000,000,000 bacterial cells. Your body can have as many as 100,000,000,000,000 (a hundred trillion) bacterial cells. It’s hard to keep track of all those microbes, so we’ll look at some ways to manage the numbers.
In this lesson you will:
Skills: ExponentsCharts, Graphs, TablesPlace Value |
|
Water...Water...Water...

Water is essential for all living things. A person can live weeks without food, but can only survive about three days without water. How much water is there in the world? How much water is in our food? Let's take a closer look at this precious liquid that infuses our world.
In this lesson you will:
Skills: MeasurementCharts, Graphs, TablesFractions, Decimals, and Percents |
Photosynthesis
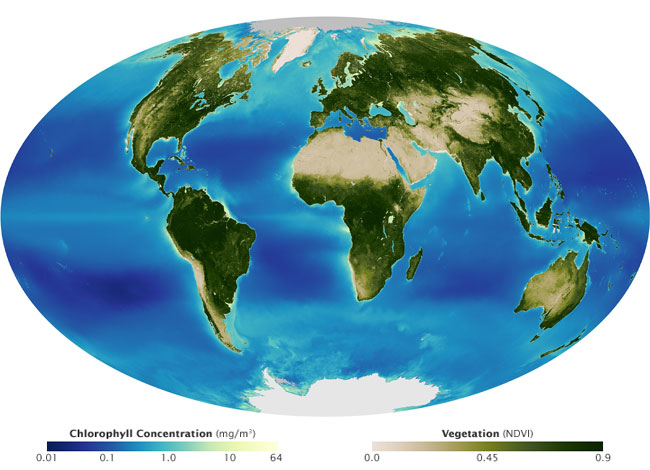
Carbon is all around us. It makes up a part of the air we breathe, the foods we eat, and it’s the basis of our own bodies. Life on earth is built around the element carbon, and that’s why we’re called carbon-based life forms. With all the living things on earth depending on carbon, what if it runs out? Luckily, carbon is always being recycled naturally in the environment. Let’s take a look at the carbon cycle and examine the amount of carbon that passes through our everyday lives.
In this lesson you will:
Skills: BiologyCharts, Graphs, Tables |
Carbohydrates
These days, everybody seems to be counting the carbohydrates in their diet—or carbs, for short. The numbers on the nutrition labels of packaged foods help carb-watchers keep track. The trick is to understand how different types of charts, graphs, and tables represent quantities.
In this lesson you will:
Skills: MeasurementCharts, Graphs, TablesConsumer Math |
